Performance
RAVidEn shares the camera's processor with the video pipeline. Most configurations leave plenty of headroom. This page covers how to watch the load, what raises it, and what to change.
App health
Open App health from the navigation bar. The figures are sampled on the camera, so the panel takes a moment to fill in.
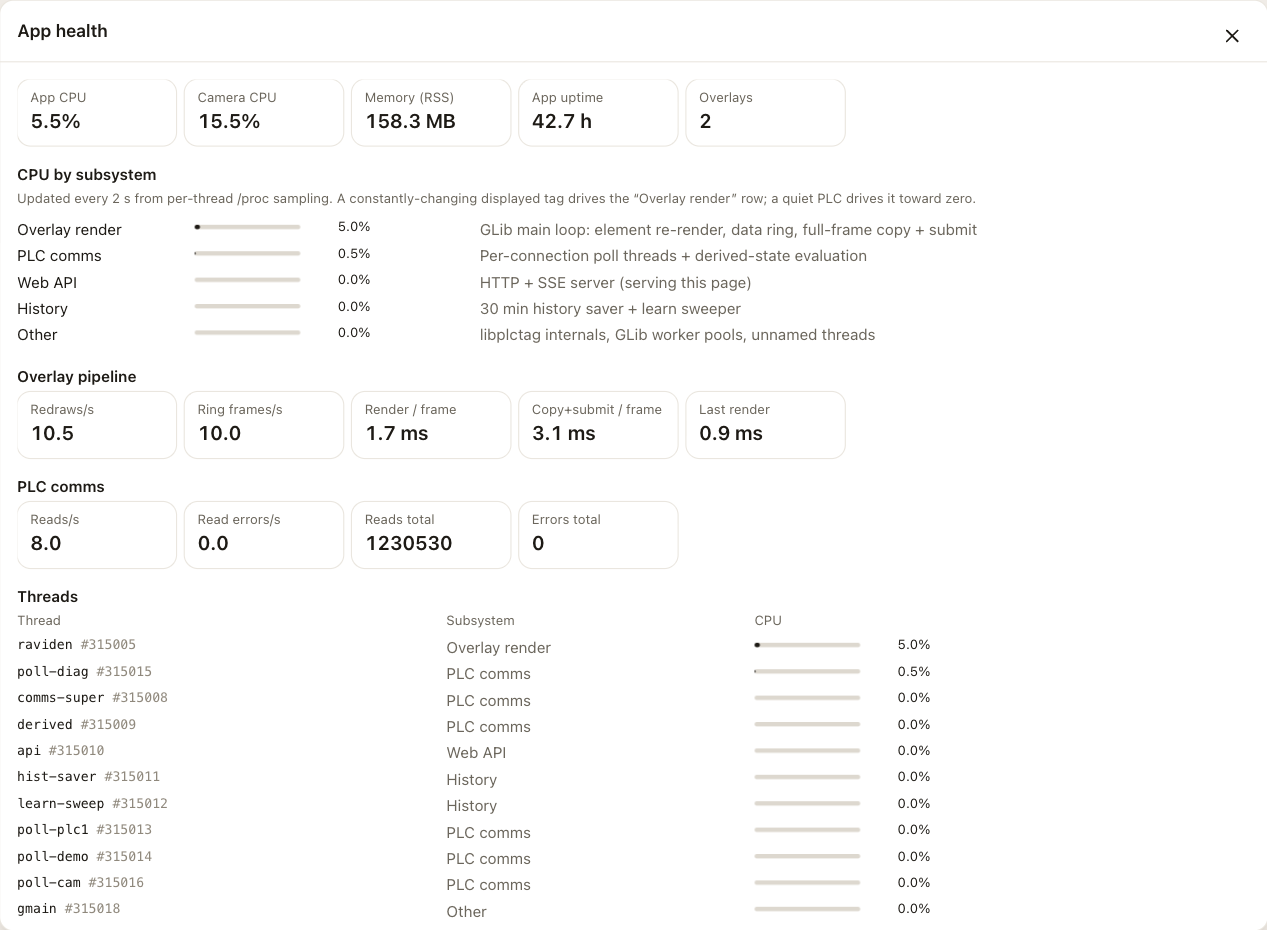
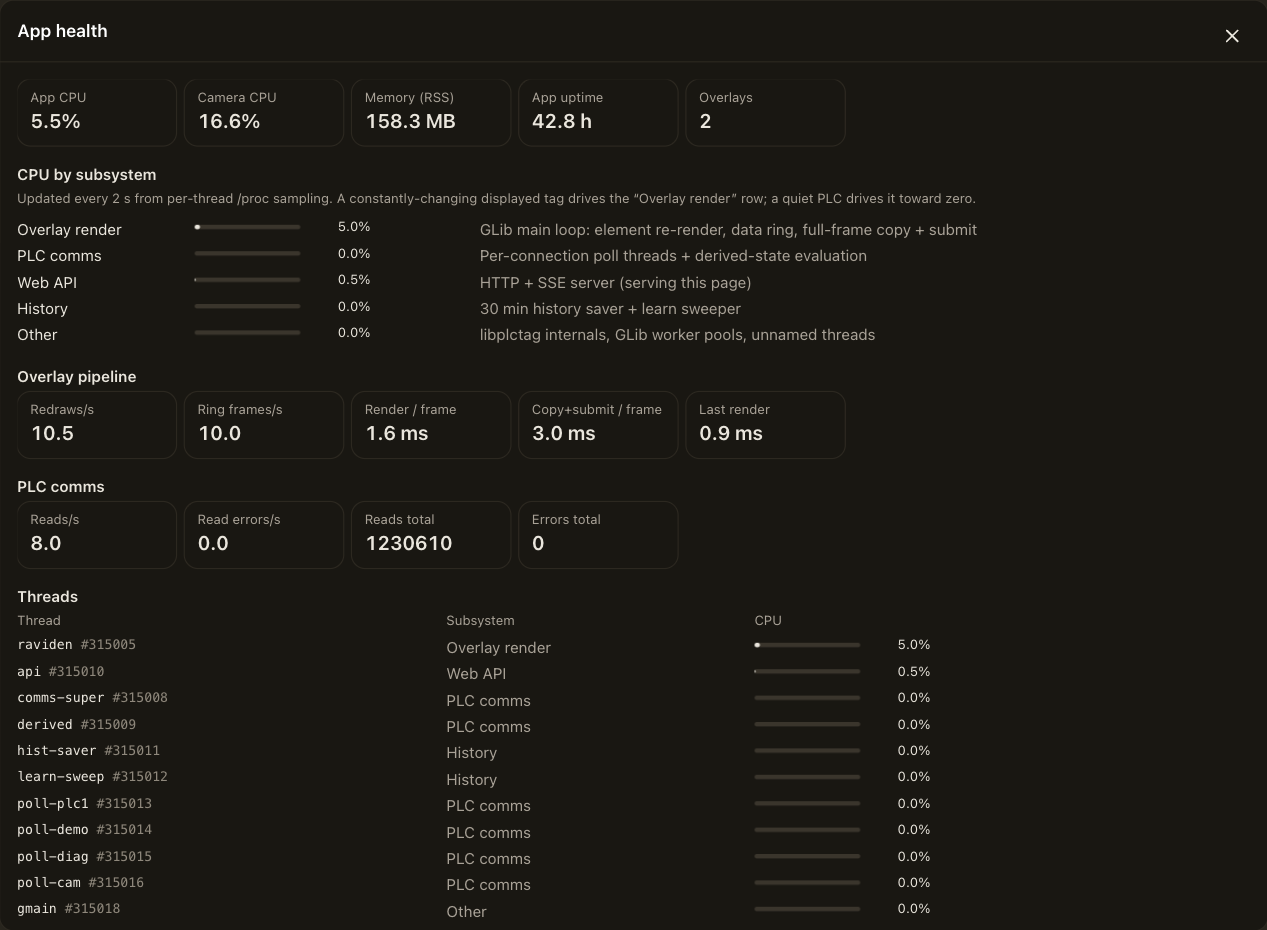
The two processor figures at the top use different denominators.
- App CPU is the total for all of RAVidEn's threads, as a percentage of one processor core.
- Camera CPU is every process on the camera, including the video pipeline itself, as a percentage of all cores.
CPU by subsystem divides RAVidEn's own time.
| Row | Covers |
|---|---|
| Overlay render | Drawing the elements, stamping the DataBorder ring, and copying each finished frame to the video pipeline. |
| PLC comms | The poll thread for each connection, and the evaluation of derived states. |
| Web API | Serving the interface you are looking at. |
| History | The half-hourly save to flash and the sweeper that retires tags no longer in use. |
| Other | The tag library's internals and the shared worker pools. |
Three sections below the table give the detail.
- Overlay pipeline shows the redraws per second across all streams, the DataBorder updates per second, and the average time spent rendering each frame and then copying it. The copy is usually the larger of the two.
- PLC comms shows the read and error rates against the controllers.
- Threads breaks the same processor time down to individual threads.
Performance tags
To follow performance over time, add a connection with the Diagnostics source and add tags from it.
| Tag | Reports |
|---|---|
cpu.total | Camera processor use, all cores |
cpu.app | RAVidEn's own processor use |
cpu.thread.main | The overlay render share |
cpu.thread.comms | The polling share |
mem.app.rss.mb | RAVidEn's memory |
load.1 | One-minute load average |
temp.c | Processor temperature, where the camera exposes it |
overlay.redraws | Overlay frames submitted, running total |
overlay.render.ms | Duration of the last render |
ring.frames | DataBorder updates encoded, running total |
comms.reads | Controller reads, running total |
comms.errors | Failed reads, running total |
These behave like any other tag: chart them, put them on the overlay, or carry them in the DataBorder. See History and charts.
Redraw cost
The overlay redraws when a displayed value changes. A value whose text changes constantly, such as a reading shown to three decimals, redraws continuously up to the rate cap. Rounding it to fewer decimals removes that work.
Each element redraws only when its own inputs change, and the cost depends on the element. Read these figures as magnitudes; an element's own settings move them.
| Element | Cost per redraw |
|---|---|
| Tick chart | About 4.5 ms |
| Robot panel, robot figure | About 2 ms |
| State strip | 1 to 2.5 ms |
| Tag table | About 0.8 ms |
| State tile | About 0.6 ms |
| Static text, image, watermark | Drawn once and then cached |
Copying each finished frame into the video pipeline costs about 3 ms per stream, regardless of how many elements are drawn, and is usually larger than the render itself. The Render / frame and Copy+submit / frame figures in App health show the split for your configuration.
Three costs have nothing to do with tag changes.
- Charts redraw on a timer. Elements that draw a window ending now refresh about once a minute even when no value changes. The state tile refreshes every ten seconds. The refreshes are staggered.
- Every stream costs a copy. Streams of the same size share one rendered picture, but each copies a full frame into the video pipeline on every submit. The Overlays tile counts the streams carrying an overlay.
- Motion easing bypasses the element cache. The Motion setting under Settings forces a redraw five times a second while a gauge or bar value is moving. It is off by default.
The DataBorder adds a small fixed cost per update for stamping the ring. Full history in stream is the one option that works continuously, because it compresses the stored history and cycles it through the DataBorder's spare capacity.
Polling is the PLC comms row. It depends on the poll interval of each connection and on how many tags are in use. Only tags that something uses are polled.
Refresh rates
Two settings govern how often the work happens. Both are rounded to the camera's compositing tick, which runs ten times a second.
| Setting | Page | Default | Range |
|---|---|---|---|
| Max redraw rate | Settings | 5 fps | 0.5 to 10 |
| DataBorder update rate | DataBorder, under Advanced | 10 fps | 1 to 10 |
The max redraw rate caps the redraws that changing values cause. A quiet overlay redraws far less often than the cap. Lowering it is the simplest way to cut drawing work.
The DataBorder update rate sets how often a new payload is generated. Every stream carrying the DataBorder carries the same payload.
A stream carrying the DataBorder is submitted on every update whether or not a displayed value changed, so on that stream the update rate sets how often the frame is copied. Lowering the redraw cap saves the drawing but not the copying. Lowering the update rate saves both, but the DataBorder then takes longer to deliver names, history and signatures to a decoder.
The update rate is independent of the video frame rate. At 25 or 30 frames per second with 10 updates per second, each update is carried by two or three consecutive frames. This repetition is what lets the DataBorder survive compression and dropped frames.
Signs of overload
On the camera, in App health:
- DataBorder updates per second below the expected figure. The figure counts one update per 1920 × 1080 stream, so two streams at 10 fps should show 20. With the DataBorder off, watch the redraws per second instead.
- Render and copy time filling the tick. The camera has 100 ms per tick to render once and copy a frame for every stream. Add Render / frame and Copy+submit / frame and multiply by Overlays. A healthy configuration uses a small part of it.
- App CPU well above its usual figure. Chart
cpu.appfrom the diagnostics source to have a baseline to compare against.
In a recording, in the decoder's signal view:
- An update held about twice as long as usual, marked in yellow in the updates lane. The camera skipped a refresh.
- A sequence gap attributed to the camera rather than to dropped frames. That sequence never reached any frame.
These are not decoding failures. Unrecoverable frames, corrections gathered in one stretch of the ring, and falling margin are picture problems caused by bitrate, compression, or something drawn over the ring. Reducing RAVidEn's load does not fix them. See Recording and the signal view.
Reducing the load
Work down this list and check App health after each step.
- Reduce the number of streams that carry an overlay. Each one copies a full frame on every submit, which is the largest single cost in the pipeline.
- Lower the DataBorder update rate. On a stream carrying the DataBorder this sets how often the frame is copied. See Refresh rates for the trade-off.
- Round the values you display. A reading shown to fewer decimals redraws far less often.
- Lower the max redraw rate under Settings. This saves drawing, and on streams without the DataBorder it saves the copy as well.
- Turn off motion easing if it is on.
- Use fewer chart elements. Charts cost the most per redraw and refresh on their own clock.
- Poll less often. Most displays do not need a reading more than once a second. Polling is usually a small share, so check the subsystem table first.
If the camera still cannot keep up, Settings → Config file → Download diagnostics captures the App health counters along with the configuration and the log. See Status and troubleshooting.