Signal view
The signal view is a protocol analyzer for the DataBorder. Switch to it with the signal toggle in the timeline header.
During a live session the signal view streams continuously and holds the last five minutes. For stored clips, it re-analyzes the selected clips on demand and shows a progress line with a stop button. MP4 and MOV clips are analyzed inside the application. Other containers need ffmpeg.
Reading it from top to bottom
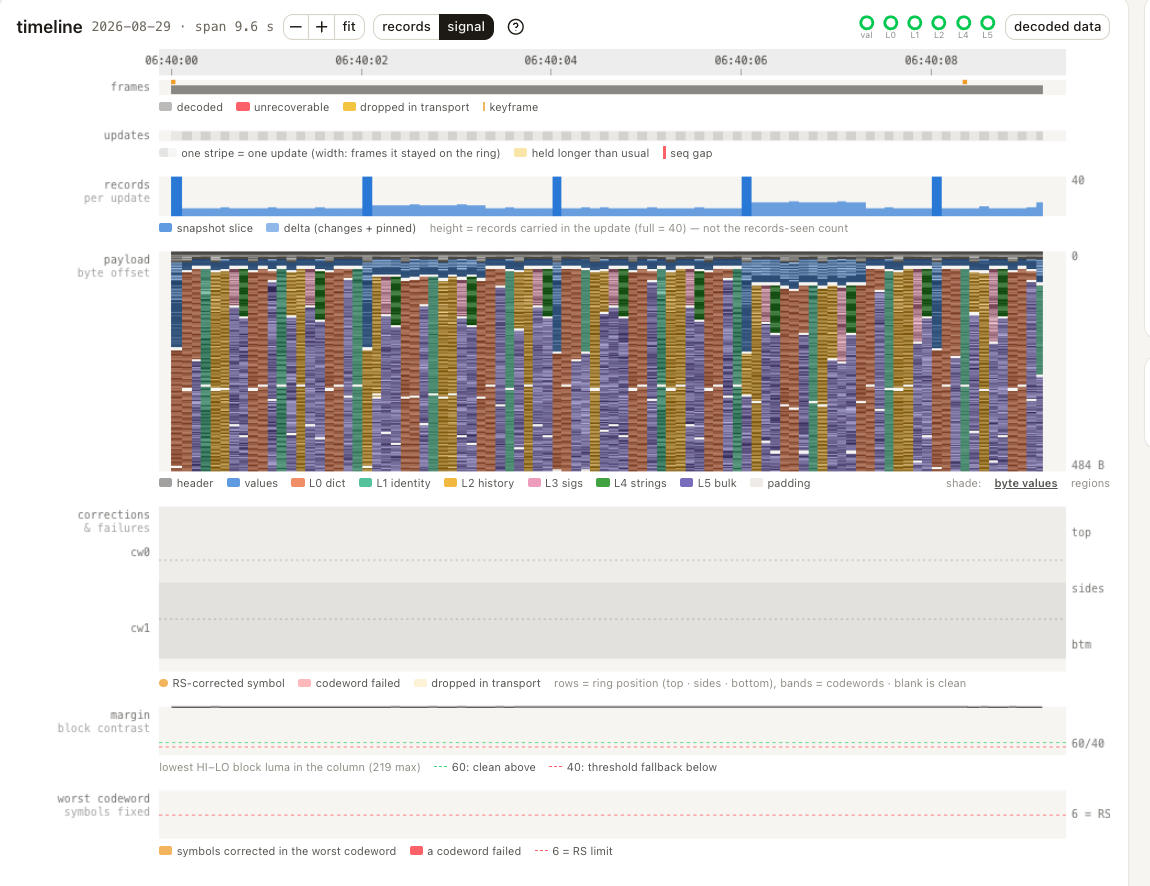
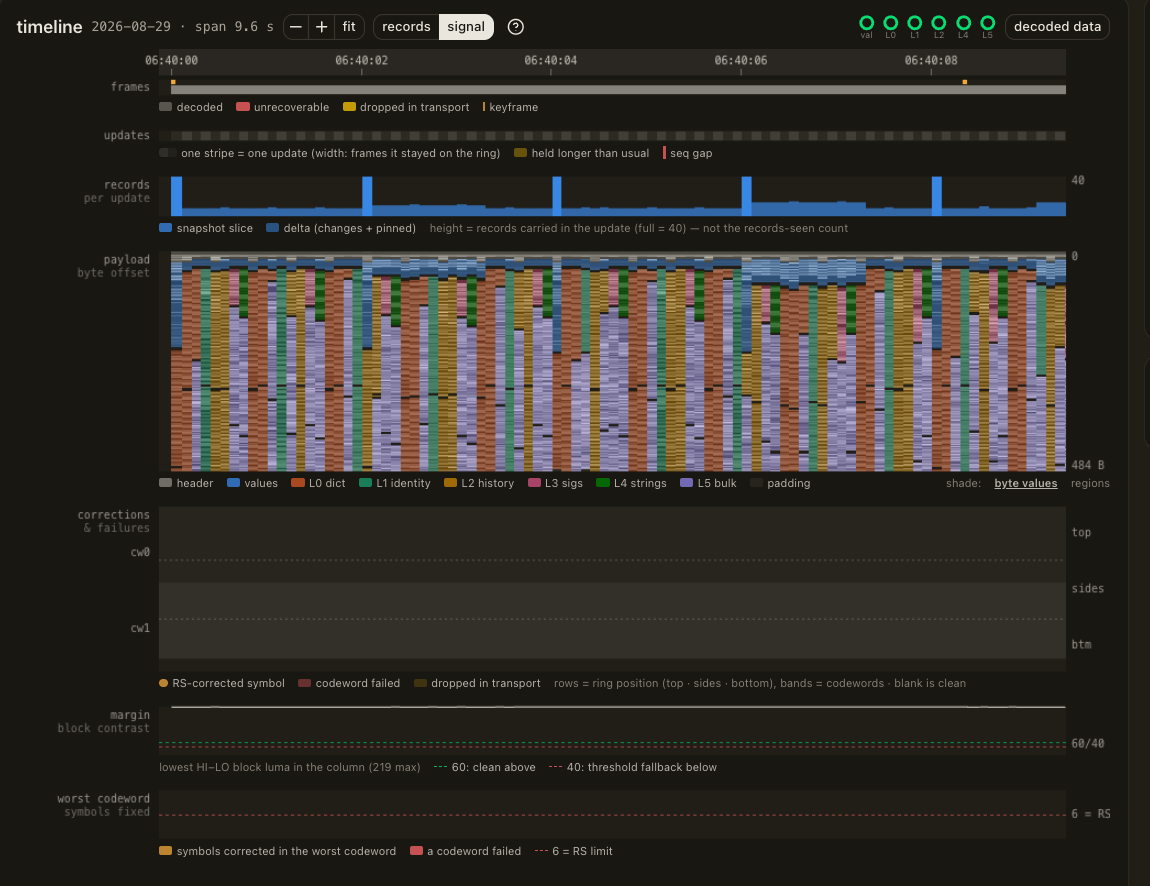
| Lane | Meaning |
|---|---|
| frames | Every frame is marked as decoded, unrecoverable, or dropped in transport, and keyframes are ticked. A healthy stream is one unbroken bar of decoded frames. |
| updates | There is one stripe per DataBorder update. A stripe is wider when the camera held the update for longer than usual. Sequence gaps are marked in red. |
| records per update | This shows how many records each update carried. The tall bars are full snapshots, which arrive every couple of seconds. The low bars in between are deltas. |
| payload | The update's bytes are laid out from top to bottom and colored by layer, so you can watch the carousel cycle. Hover over a layer in the legend to isolate it. |
| corrections and failures | This shows the symbols that the error correction had to fix, by position around the ring: top edge, sides, and bottom edge. Blank means clean. A failed codeword is shown as a red column. |
| margin | This is the contrast between light and dark blocks. Above 60 is clean. Below 40, the decoder falls back to a slower threshold method. |
| worst codeword | This is the number of symbols corrected in the worst codeword of each update. Six is the limit. At seven, the codeword fails. |
The help button next to the toggle explains each lane in place, with a sketch.
Patterns
The findings list under the chart adds up the totals and points to the likely cause. The common patterns:
- Falling margin with rising corrections means that a recorder or a stream profile is compressing too hard. Raise the bitrate on the profile the recorder uses, or record a different profile. See Recording.
- Corrections concentrated in one stretch of the ring, which the findings call out as a hot spot, usually mean that something is drawn over the ring in that place. This is typically the camera's clock or a text overlay, or a fixed element in a screen recording. Move it off the border.
- Dropped frames, and sequence gaps the findings attribute to transport, point to the network path rather than the picture.
- Updates held longer than usual, and sequence gaps attributed to the camera, mean the camera skipped a DataBorder refresh. This is load on the camera rather than a fault in the stream. See Performance.
- A clean signal with values that look wrong is not a signal problem. Check the tag configuration on the camera.
The frame inspector
Click on the signal view to place the cursor. The at cursor panel then becomes a frame inspector for that frame. It shows whether the DataBorder decoded and by which method, the margin, the corrections per codeword, the update's flags and fragments, the payload as a grid of bits, and a hex dump colored by layer. A frame whose codeword failed shows no bytes at all, because the decoder never displays data it could not validate.