Decoded data
Each DataBorder update carries the values that changed, plus a slice of a carousel that cycles through everything else a decoder needs. The decoded data button in the timeline header opens what the current selection has recovered, one tab per part. A longer clip has seen more of the carousel, so it fills in more.
| Tab | Contents |
|---|---|
| config | The record dictionary. It lists every record's name and type, whether it is pinned, and how many times it changed in the clip. Click a record to open its detail. |
| identity & states | The camera and the application version that wrote the DataBorder, the fingerprint of the camera's signing key, and the label and color of every state value. |
| history | The recent runs of each state tag that the camera carried in the stream. Even a short clip shows what the machine was doing before the clip began. |
| full history | The camera's own stored history, described below. |
| strings | The current text of every string record, and the generation in which it changed. |
| signatures | Each signature the clip contains, the range of updates it covers, whether the signature verified against the camera's key, and whether the chain head it signs matches what was captured. |
| decode | Statistics for each clip: the frames decoded and unrecoverable, the ring thickness found, the frame rate, and any warnings. |
An empty tab explains why it is empty. Either the clip was too short to see that part of the carousel, or the camera does not send it.
Full history
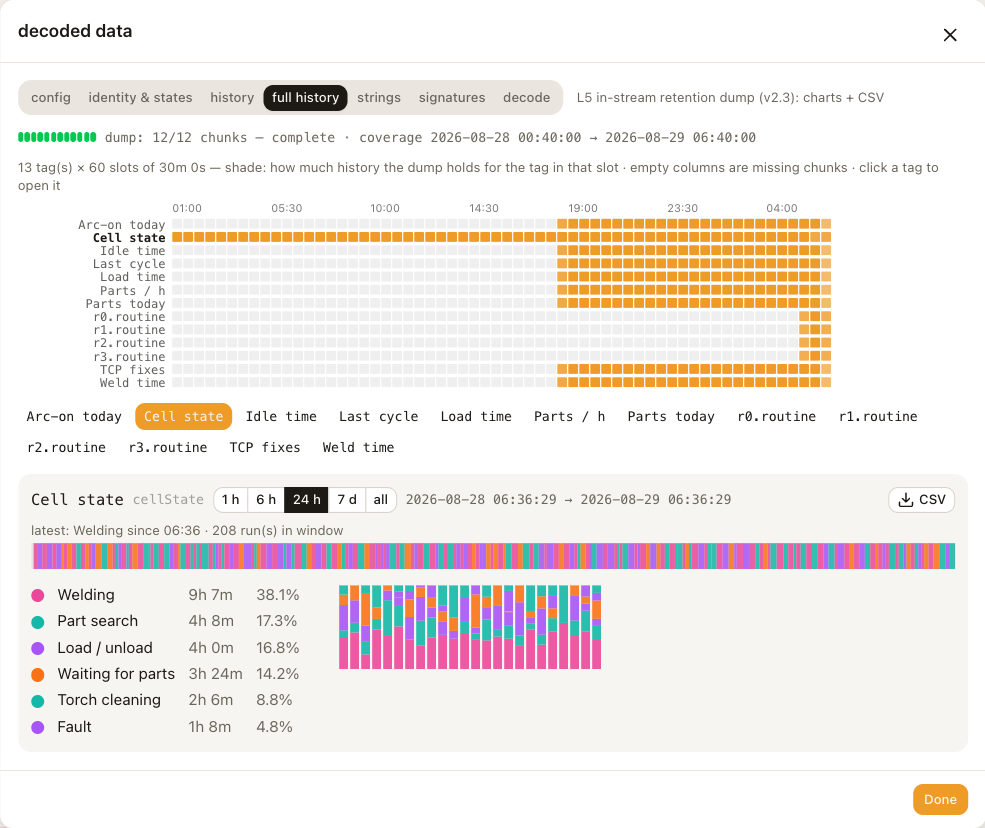
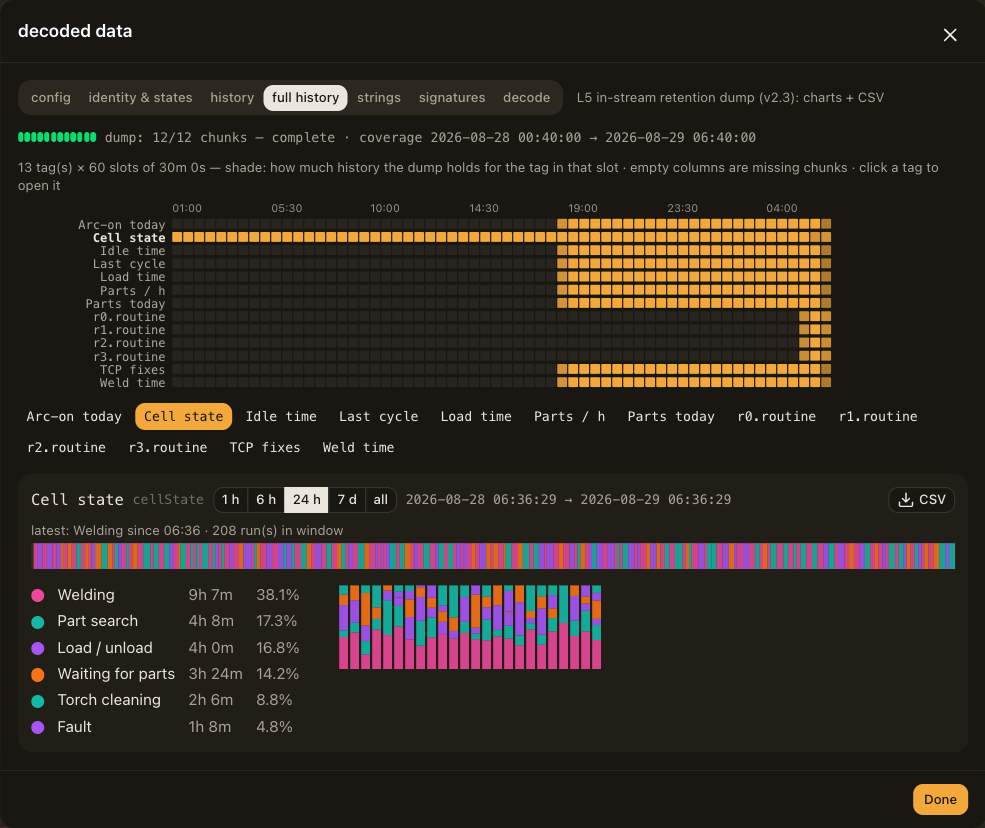
When the camera is configured to cycle its stored history through the DataBorder, the full history tab reassembles it from the clip. The history arrives in chunks, newest first, and the header says how many of them the clip recovered.
- The coverage grid shows one row per tag and one column per half hour, shaded by how much of that slot the clip recovered. Empty columns inside the range are chunks the clip did not see. A longer clip fills them in.
- Click a tag to open its chart. Choose a window of 1 h, 6 h, 24 h, 7 d or all. Measurements are plotted as an envelope of minimum, maximum and average. State tags show a run strip, the total time and share in each state, and the breakdown per hour. Strings list their changes.
- CSV downloads the tag's data for the chosen window. For a measurement this is the buckets, for a state it is the runs and the hourly totals, and for a string it is the changes.
For a live session, the full history appears once the session is stopped. The history the camera keeps is described on the History and charts page.