Status and troubleshooting
Status
The navigation bar carries a badge for each part of the system: the number of connections that are up, the number of tags that are healthy, whether the DataBorder is on, the size of the history, and the application's CPU use. Click a badge for the detail.
- Connections shows each source's state, its last successful read, and the reason for the last failure.
- Tag library shows every tag's current value, its quality, when it last updated, and its read and error counts.
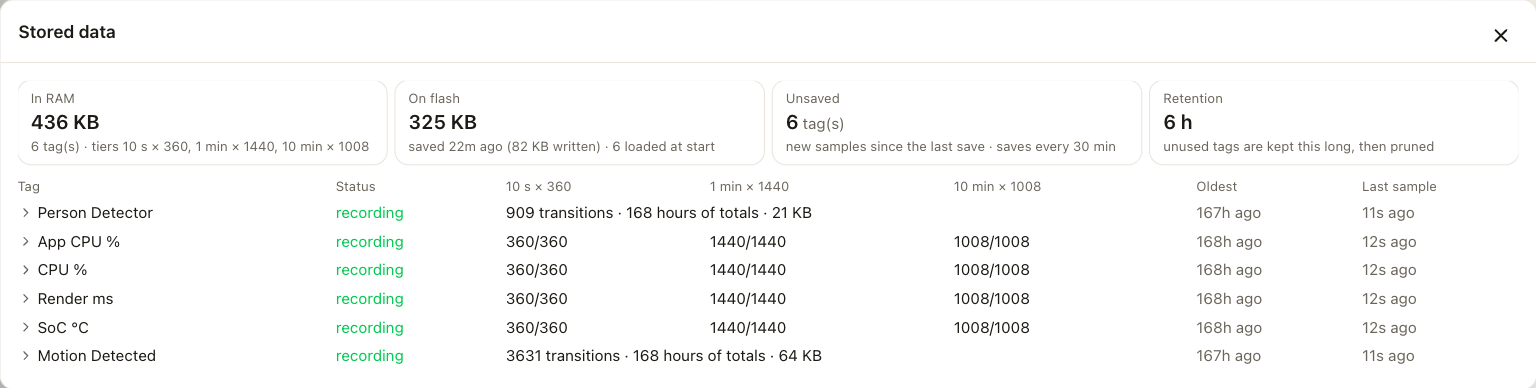
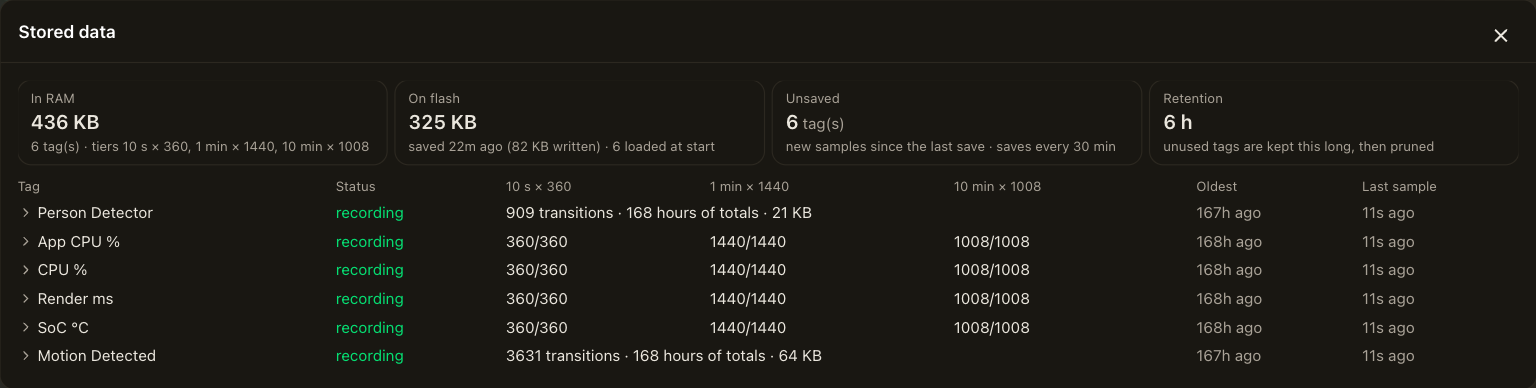
- Stored data shows each tag's history: how full each tier is, the oldest sample, the last save to flash, memory and flash use, and whether the tag is recording, frozen because it is no longer used, or waiting to be pruned.
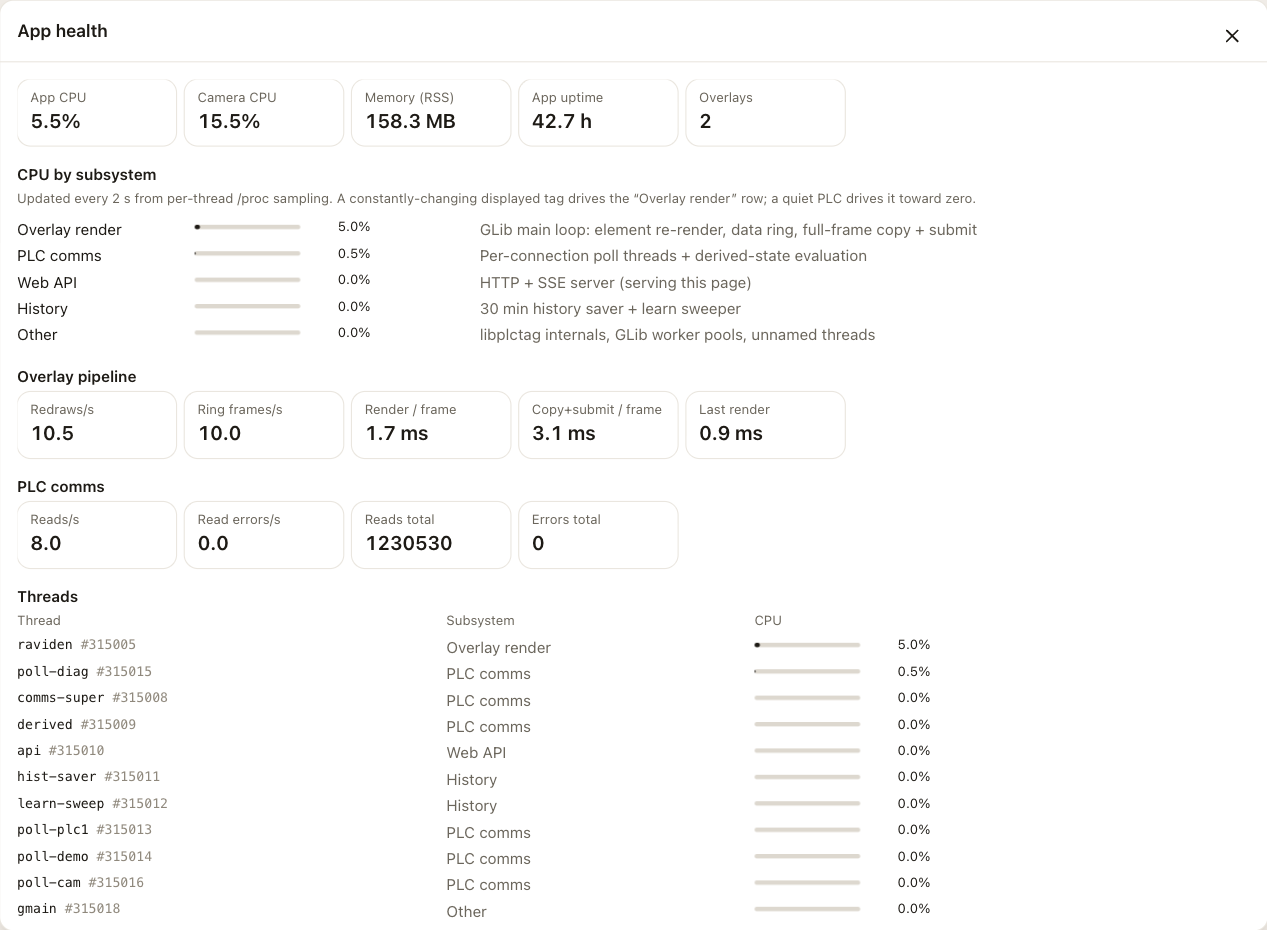
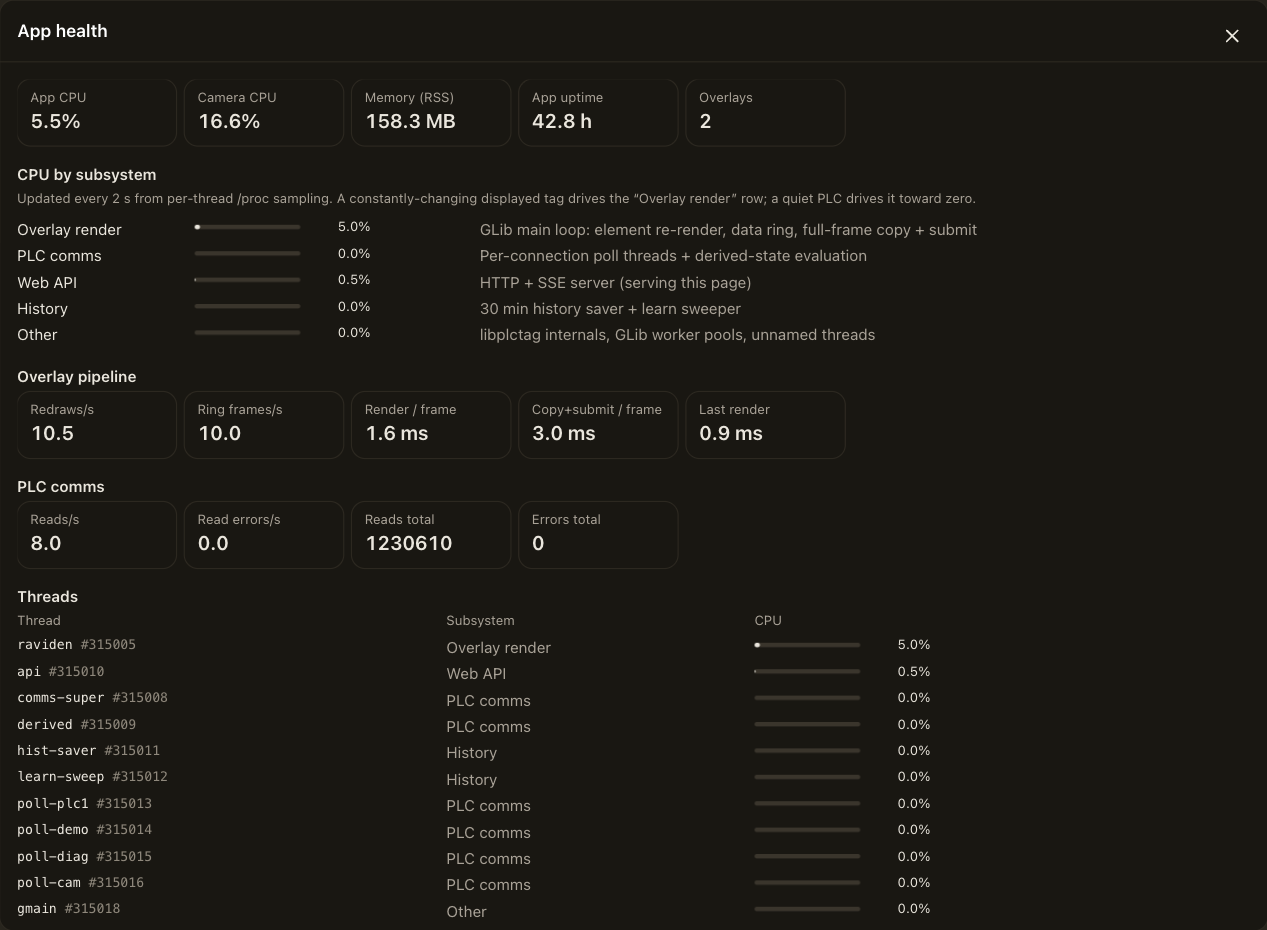
- App health shows the application's CPU use by subsystem, the camera's CPU and memory, the overlay redraw rate and render time, the DataBorder update rate, and the read rate against the controller.
Values show a !
The ! after a value means that the last read failed and the value shown is the last good one. Open Connections to see why. The controller may be unreachable, the credentials may be wrong, or the timeout may be too short for the network. Individual tags can also fail while the connection is up, if the address is wrong or the data type does not match. The Tag library shows those tags with a bad quality and the error text.
A tag never gets a value
- Check that the tag is used. Only tags on the overlay, in the DataBorder or feeding a derived state are polled. An unused tag shows no value by design.
- Check the address. Each source has its own address form, described on its page under Connections. Browsing avoids typing mistakes.
- Check the data type. A real that is read as an integer, or a bool that is read as a string, fails.
The DataBorder does not decode
- The DataBorder is drawn only on the 1920 × 1080 stream. Make sure the recording is of that profile.
- Check that the camera's own overlays are not drawn over the ring. See Camera overlays.
- Check the bitrate. See Recording.
- Open the clip in the decoder's signal view to see which of these is the cause.
The camera is working too hard
App health shows where the time goes. See Performance for how to read it, what raises the load, and how to bring it down.
Save & apply is refused
The camera validates the configuration before applying it and lists what is wrong. Common causes are a record name longer than 16 characters, a snapshot-profile DataBorder whose dictionary does not fit in one update, and a state map with a duplicate value.
Getting help
Settings → Config file → Download diagnostics saves a file that contains the application version, the camera model, the application log, the live status, the app health counters, and the configuration with passwords removed. Send this file with any support request.
The amount of logging is set by the logLevel setting in the configuration. See the configuration reference.